Ribo-seq vs RNA-seq: When do you need each?

The core difference: transcription vs translation

The main Ribo-seq vs RNA-seq difference is the stage of gene expression each method measures. RNA-seq captures the RNA molecules present in a sample, subject to library preparation, and provides a snapshot of the transcriptome. It shows which genes are transcribed and how abundant their RNA products are.

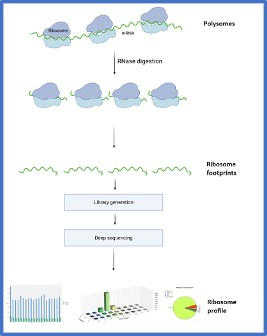
Ribo-seq, also called ribosome profiling, measures translation. It isolates the approximately 28–30 nucleotide fragments protected by actively translating ribosomes. These ribosome-protected fragments, or RPFs, reveal which RNA regions are engaged by ribosomes at sampling. They represent the translatome: the fraction of the transcriptome being translated into protein. The study of this translation-focused layer of gene expression is commonly described as translatomics.

RNA-seq is like a library catalogue: it tells you which books exist and how many copies are on the shelf. Ribo-seq tells you which books are actually being read right now. This distinction matters when transcript abundance does not predict protein synthesis because translation is selectively regulated. In practical terms, researchers comparing ribosome profiling vs transcriptomics are comparing evidence of active translation with a broader analysis of RNA abundance and transcript structure.

Ribosome profiling was first described by Ingolia et al., 20091. Their method established that sequencing ribosome-protected fragments could reveal which transcripts are actively translated and at what density, at near-codon resolution across the entire transcriptome.
Ribo-seq vs RNA-seq-When do you need each_OHMX.bio

What RNA-seq measures and where it stops

RNA-seq provides a broad view of the transcriptome. It supports gene expression profiling across thousands of genes, differential expression analysis between experimental conditions, isoform and splice variant detection, novel transcript discovery, non-coding RNA profiling, and fusion gene detection. These capabilities make RNA-seq well suited to questions about which transcripts are present and how their abundance changes.


Its main limitation is that mRNA abundance does not equal protein output. Post-transcriptional mechanisms can decouple transcription from translation through upstream open reading frames, RNA-binding proteins, microRNAs, and stress-responsive control of ribosome recruitment. RNA-seq cannot measure this regulatory layer because it detects RNA molecules regardless of whether ribosomes translate them.


This distinction has practical consequences. Schwanhäusser et al. reported correlations of approximately 0.4 to 0.6 between mRNA and protein levels across mammalian cells, indicating that transcript abundance often predicts protein production only partially (Schwanhäusser et al., 2011)2.


When a research question concerns protein function, pathway activity, or the effect of a drug on cellular behaviour, RNA-seq alone may therefore provide an incomplete or misleading interpretation. A transcript can increase without a corresponding rise in translation, while another may produce more protein despite little change in RNA abundance.

When RNA-seq is sufficient

RNA-seq is the appropriate first-line method when transcript abundance, identity, or structure provides the evidence needed to answer the research question. Use RNA-seq when:

  • The primary endpoint is differential gene expression between conditions.
  • You need splice-junction, isoform, or transcript-structure analysis.
  • You are developing biomarkers from transcriptomic signatures.
  • You need to detect fusion transcripts.
  • You are profiling coding or non-coding RNA populations.
  • You are characterising the transcriptome of a non-model organism.

When translational regulation is not part of the research question, RNA-seq generally provides the most direct and proportionate experimental design.

When RNA-seq is not enough

RNA-seq can lead to an incomplete biological interpretation when changes in transcription do not match changes in translation.

This is common during cellular stress. In the integrated stress response and the unfolded protein response, cells often reduce overall protein synthesis while continuing to translate a smaller group of stress-response mRNAs. A similar disconnect can occur in drug mechanism-of-action studies. A compound may lower ribosome engagement on pro-survival transcripts even when their RNA abundance remains unchanged.
Cancer cells can also reshape translation initiation and ribosome recruitment to support oncogenic protein synthesis without producing equivalent changes in transcript levels. The same issue matters in mRNA therapeutics: detecting the therapeutic RNA confirms that the transcript is present, but not that it is being translated efficiently into the intended protein.
For these research questions, stable RNA abundance should not be treated as evidence of stable protein synthesis. Ribo-seq, often used alongside RNA-seq, is required when the key regulatory change occurs at the level of translation.

What Ribo-seq adds: measuring active translation

Ribo-seq shows where ribosomes are actively translating RNA by sequencing ribosome-protected fragments, or RPFs. These fragments map the regions occupied by ribosomes and can resolve translation at near-codon-level resolution. This makes it possible to identify translated coding regions, upstream open reading frames, small open reading frames within annotated non-coding RNAs, and positions where ribosomes pause or stall at particular codons or sequence motifs.

The clearest picture comes from analysing matched RNA-seq and Ribo-seq data from the same biological sample. RNA-seq measures mRNA abundance, whereas Ribo-seq measures ribosome occupancy. Combining both datasets allows translation efficiency to be calculated for each gene as RPF density divided by mRNA abundance. Neither method can provide this measure on its own.

Translation efficiency helps explain why genes with similar transcript levels can produce very different amounts of protein. Differences in ribosome recruitment, translation initiation, elongation, and pausing can all affect protein output without altering mRNA abundance. OHMX.bio prepares matched RNA-seq and Ribo-seq libraries from the same sample, which improves comparability, limits technical variation, and provides a more complete view of transcriptional and translational regulation.

Translation efficiency: the metric RNA-seq cannot give you

Translation efficiency, or TE, is calculated as normalised ribosome-protected fragment counts divided by normalised mRNA counts for each gene. A translation efficiency RNA-seq analysis is incomplete without matched Ribo-seq data because RNA-seq measures mRNA abundance but not ribosome occupancy. This ratio estimates the proportion of a transcript population engaged with ribosomes at sampling and answers a practical question: of all the mRNA present, how much is being used to make protein?

Consider a kinase inhibitor that suppresses translation of pro-survival mRNAs without altering their transcript abundance. RNA-seq would report no change and could miss the drug’s mechanism of action entirely. Ribo-seq detects the reduction in ribosome occupancy, while matched RNA-seq establishes that the effect occurs at translation rather than transcription.

TE identifies genes under translational control, reveals regulatory bottlenecks, and shows how cells allocate protein synthesis capacity across transcripts (Brar and Weissman, 2015)3.

Novel ORF discovery: uORFs, sORFs and non-canonical translation

Ribo-seq identifies previously unannotated open reading frames by showing which RNA regions are actively translated. These include upstream ORFs in 5′ untranslated regions, where altered translation can regulate a downstream main ORF without changing mRNA abundance. Ribo-seq also detects small ORFs within long non-coding RNAs and other transcripts. Some of these sORFs encode biologically active micropeptides. In addition, initiation at non-AUG codons can produce alternative proteoforms that standard gene annotations overlook.

These capabilities support neoantigen discovery because non-canonical translation can generate tumour-specific peptides for presentation by MHC molecules. Ribo-seq provides evidence that candidate open reading frames are translated. It does not, by itself, demonstrate that the resulting peptide is processed and presented by MHC molecules. Immunopeptidomics or targeted validation is required to confirm peptide presentation. This validation step allows researchers to prioritise the most relevant targets for cancer immunotherapy pipelines. The same assay detects small ORF-encoded micropeptides that support essential functions in cancer cells. Some translated micropeptides may contribute to tumour-cell survival or proliferation and may warrant further functional investigation. For immuno-oncology programmes, this evidence helps prioritise candidate ORFs for downstream validation.

OHMX.bio’s ORF-discovery analysis incorporates RiboTIE, a transformer-based tool developed specifically to detect translated ORFs from Ribo-seq (Clauwaert et al., 2025)4.

Ribosome stalling and codon usage analysis

Ribo-seq can identify candidate regions of increased ribosome occupancy associated with pausing or slow elongation, although sequence and library-preparation biases must be considered during interpretation. These patterns can inform codon optimisation, removal of problematic sequence features, and studies of translation kinetics or cotranslational folding. This analysis is particularly relevant to mRNA vaccine and therapeutic development, where small sequence changes can affect protein yield. OHMX.bio includes this analysis in its mRNA development workflows, as discussed on our mRNA solutions page.

Ribo-seq vs RNA-seq: side-by-side comparison

RNA-seq and Ribo-seq examine different points in the gene expression process. RNA-seq is the better fit when the main question concerns transcript abundance, transcript structure, or changes in gene expression. Ribo-seq becomes necessary when the study needs to determine which transcripts are actively translated. The table below compares what each method measures, the data it produces, and the projects for which it is best suited.

Feature

RNA-seq

Ribo-seq

What it measures

All RNA molecules represented in the transcriptome

Ribosome-protected fragments representing the translatome

Primary output metrics

Transcript counts, differential expression, and isoforms

RPF counts, translation efficiency, and ORF occupancy

Detects transcription changes

Yes

No

Detects translation changes

No

Yes

Reveals protein output

Indirectly, because mRNA abundance correlates only partly with protein production

More directly through ribosome occupancy

Input material requirements

100 ng–1 µg total RNA

25–50 million cells or 10–50 µg lysate

Platforms at OHMX.bio

Illumina and Element AVITI

Illumina for Ribo-seq libraries

Sample compatibility

Fresh, frozen, FFPE, and liquid biopsy samples

Flash-frozen cell pellets or tissue, with lysis performed in-house by OHMX.bio

Best use cases

Gene expression profiling, biomarker discovery, and isoform analysis

Translational regulation, ORF discovery, drug mechanism of action, and neoantigen discovery


OHMX.bio can prepare matched RNA-seq and Ribo-seq libraries from the same biological sample. This matched design makes it possible to compare transcriptional and translational regulation directly and to calculate translation efficiency with greater confidence.

Ribo-seq vs RNA-seq: when to use each or both

Deciding when to use Ribo-seq depends on whether your research question concerns transcript abundance, active translation, or both.

Use RNA-seq when:

  • Your primary endpoint is differential transcript abundance.
  • You need isoform, exon, or splice-junction analysis.
  • You are developing a biomarker based on a transcriptomic signature.
  • You need fusion-transcript detection.
  • You are investigating coding or non-coding RNA populations.
  • You are characterising a poorly annotated transcriptome.

Use Ribo-seq when:

  • The study focuses on translational regulation rather than transcript abundance alone.
  • You need to confirm whether an annotated or non-canonical ORF is being translated.
  • The project involves uORFs, sORFs, or alternative translation initiation sites.
  • A drug may change ribosome engagement without altering mRNA levels.
  • You are evaluating translation from an mRNA vaccine or therapeutic construct.
  • Candidate ORFs need to be prioritised for neoantigen discovery or drug-target research.

Use both (matched RNA-seq + Ribo-seq) when:

Matched analysis is the preferred design when you need to distinguish transcriptional regulation from translational regulation. Use both when:

  • Translation efficiency is a primary endpoint.
  • A drug mechanism may involve both transcription and translation.
  • You need to determine why protein synthesis changes between conditions.
  • You are evaluating an mRNA therapeutic from transcript abundance through ribosome engagement.
  • You are investigating stress responses or other forms of post-transcriptional control.
  • You need transcript abundance and translation evidence for candidate ORFs.

OHMX.bio prepares matched RNA-seq and Ribo-seq libraries from the same biological material, reducing variation between assays and supporting direct statistical comparison.

Practical considerations before starting a Ribo-seq project

Ribo-seq requires more material and tighter sample handling than RNA-seq. A typical project needs 25–50 million cells or 10–50 µg of lysate. OHMX.bio accepts flash-frozen cell pellets or tissue samples and performs lysis, nuclease digestion, and ribosome footprint isolation in-house, so clients can ship frozen material without establishing the protocol in their own laboratory.

Sample preparation may use cycloheximide treatment or immediate flash-freezing, depending on the biological system and the aims of the study. OHMX.bio has validated workflows for both methods and provides project-specific guidance before sample collection to minimise artefacts and preserve ribosome occupancy.

OHMX.bio is a Ghent University spin-off with experience across more than 50 Ribo-seq projects and more than 20 related scientific publications. Its capabilities include mammalian and plant Ribo-seq, advanced ORF discovery with RiboTIE, and GCLP-compliant workflows for clinical and translational research. OHMX.bio operates under a robust quality management system, certified to ISO 9001, ensuring consistent quality in all our processes and services. Furthermore, our commitment to data security and confidentiality is demonstrated by our ISO 27001 certification, which governs the protection of your sensitive data throughout its lifecycle. Standard projects typically take four to six weeks from sample receipt to data delivery. Confirm the expected schedule during project design, as timing depends on sample number, library quality, and analytical scope. The standard bioinformatics package includes quality control and differential translation-efficiency analysis. The advanced package adds novel ORF discovery through RiboTIE, including uORFs, sORFs, and non-canonical translation events.

For clinical and translational research, OHMX.bio also offers GCLP-compliant Ribo-seq. Researchers define the biological question and experimental design, while OHMX.bio manages the technical complexity from sample processing through data interpretation.

Conclusion

RNA-seq and Ribo-seq are complementary technologies because they measure different stages of gene expression. RNA-seq reveals the transcriptome, while Ribo-seq reveals the translatome and shows which transcripts are actively engaged by ribosomes. When combined, the two assays connect changes in RNA abundance with changes in protein synthesis, providing a more complete view from transcription through translation. Learn more about our Ribo-seq services and matched analysis options. Explore our RNA-seq services for transcriptome profiling and differential expression analysis. Not sure which approach fits your research question? Our Ribo-seq experts will advise you. Contact us to discuss your project and receive a custom proposal.

Frequently asked questions about biomarkers

RNA-seq quantifies all RNA molecules present in a biological sample. The assay captures coding and non-coding transcripts alike, providing a measurement of transcript abundance for each gene. This output represents the transcriptome—the complete set of RNA molecules in the cell at the time of collection.

Ribo-seq uses a different principle. The assay treats samples with a nuclease that digests unprotected RNA. Only the fragments shielded by actively translating ribosomes survive this digestion. Sequencing these protected fragments reveals which transcripts carry ribosomes and where those ribosomes are positioned. This output represents the translatome, the subset of the transcriptome that is undergoing active protein synthesis.

In most cases, no. The two assays answer fundamentally different questions. RNA-seq addresses transcriptional output: which genes are being transcribed and at what levels. Ribo-seq addresses translational activity: which transcripts are associated with ribosomes and therefore being translated into protein.

Researchers who run both assays from the same sample gain additional insight. Comparing transcript abundance with ribosome occupancy yields translation efficiency, the fraction of each transcript that is engaged with ribosomes. This metric reveals post-transcriptional regulation that neither assay alone can detect.

Translation efficiency compares the number of ribosome-protected fragments with mRNA abundance for each gene after normalisation. The ratio shows how strongly each transcript is engaged by ribosomes. This matters because similar transcript levels do not always produce similar amounts of protein. Differences in ribosome recruitment, initiation, or elongation can place one gene under translational regulation while leaving another largely unaffected. RNA-seq alone cannot resolve that difference.

Most Ribo-seq projects require 25–50 million cells or 10–50 µg of cell lysate. OHMX.bio accepts flash-frozen cell pellets and tissue samples, then carries out lysis and ribosome footprinting in-house. Sample preparation, freezing, storage, and shipping requirements are discussed before collection so that ribosome occupancy is preserved as accurately as possible.

The standard package focuses on differential translation efficiency analysis and identifies genes whose ribosome occupancy changes relative to their mRNA levels. The advanced package adds novel ORF discovery using RiboTIE, including analysis of uORFs, sORFs, and non-canonical translation events. Both packages include quality control, data visualisation, and support with biological interpretation.

Yes. OHMX.bio prepares matched RNA-seq and Ribo-seq libraries from the same biological sample. Because both datasets come from the same material, researchers can calculate translation efficiency more accurately and determine whether an observed change arises at the transcriptional level or through altered ribosome occupancy.

OHMX.bio works with flash-frozen cell pellets, cultured cells, and tissue samples. Validated workflows cover mammalian cells, plant tissues, and clinical samples. Since handling requirements vary across these materials, the team provides project-specific guidance for collection, freezing, storage, and shipment.

Do you have questions about Ribo-seq or RNA-seq?

Fill out the form below and our experts will get back to you as soon as possible!

References

  1. Ingolia NT, Ghaemmaghami S, Newman JRS, Weissman JS. Genome-wide analysis in vivo of translation with nucleotide resolution using ribosome profiling. Science. 2009;324(5924):218–223. doi:10.1126/science.1168978.

  2. Schwanhäusser B, Busse D, Li N, Dittmar G, Schuchhardt J, Wolf J, Chen W, Selbach M. Global quantification of mammalian gene expression control. Nature. 2011;473(7347):337–342. doi:10.1038/nature10098.

  3. Brar GA, Weissman JS. Ribosome profiling reveals the what, when, where and how of protein synthesis. Nature Reviews Molecular Cell Biology. 2015;16(11):651–664. doi:10.1038/nrm4069.

  4. Clauwaert J, McVey Z, Gupta R, Yannuzzi I, Basrur V, Nesvizhskii AI, Menschaert G, Prensner JR. Deep learning to decode sites of RNA translation in normal and cancerous tissues. Nature Communications. 2025;16(1):1275. doi:10.1038/s41467-025-56543-0.

Search all posts

Popular news & events

Biomarkers, CDx & precision medicine_OHMX.bio

Tags